Tabular Data Classification
This is a complete example of training a model for binary classification.
These interactive notebooks follow the steps of this example:
- Ludwig CLI:

- Ludwig Python API:
Download the Adult Census Income dataset
Adult Census Income is an extract of 1994 Census data for predicting whether a person's income exceeds $50K per year. The data set consists of over 49K records with 14 attributes with missing data.
ludwig datasets download adult_census_income
This command will create a dataset adult_census_income.csv in the current directory.
The columns in the dataset are
| column | description |
|---|---|
| age | numeric variable, age of person |
| workclass | categorical variable, Type of empolyment |
| fnlwgt | numeric variable, no defintion |
| education | categorical variable, education level |
| education-num | nmeric variable, no definition |
| marital-status | categorical variable, marital status |
| occupation | categorical variable, occupation |
| relationship | categorical variable, Relationship to household |
| race | categorical variable, race |
| sex | categorical variable, gender |
| capital-gain | numeric variable, no definition |
| capital-loss | numeric variable, no definition |
| hours-per-week | numeric variable, hours worked per week |
| native-country | categorical variable, Country of origin |
| income | binary variable, " <=50K" or " >50K" |
| split | numeric variable, indicating data split training(0), test(2) |
Train
The Ludwig configuration file describes the machine learning task. There is a vast array of options to control the learning process. This example only covers a small fraction of the options. Only the options used in this example are described. Please refer to the Configuration Section for all the details.
First 'preprocessing' section defines the gloabl preprocessing options. All numeric features are z-scored normalized, i.e., mean centered and scaled by the standard deviation. Numeric missing values are filled in with the mean of non-missing values.
The input_features section describes each of the predictor variables, i.e., the column name and type of input variable: number or category
The 'combiner' section defines how the input features are combined to be passed to the output decoder. This example uses the concat combiner, which simply concatenates the output of the input feature encoders. The combined data is passed through a three layer fully connected network of 128 cells in each layer with dropout regularization.
Next the output_features are defined. In this example, there is one response variable called income. This is a binary feature with two possible values: " <=50K" or " >50K". Because thes values are not conventional binary values, i.e., "True" and "False", a feature specific preprocessing option is specified to indicate which string (" >50K") is interpreted as "True". A four layer fully connected decoder of 32 cells in each layer is specified for this output feature.
The last section in this configuration file describes options for how the the trainer will operate. In this example the trainer will process the training data for 10 epochs. The optimizer type is "adam".
preprocessing:
  number:
    normalization: zscore
    missing_value_strategy: fill_with_mean

input_features:
  - name: age
    type: number
  - name: workclass
    type: category
  - name: fnlwgt
    type: number
  - name: education
    type: category
  - name: education-num
    type: number
  - name: marital-status
    type: category
  - name: occupation
    type: category
  - name: relationship
    type: category
  - name: race
    type: category
  - name: sex
    type: category
  - name: capital-gain
    type: number
  - name: capital-loss
    type: number
  - name: hours-per-week
    type: number
  - name: native-country
    type: category

combiner:
  type: concat
  num_fc_layers: 3
  output_size: 128
  dropout: 0.2

output_features:
  - name: income
    type: binary
    preprocessing:
      fallback_true_label: " >50K"
    num_fc_layers: 4
    output_size: 32

trainer:
  epochs: 10
  optimizer:
    type: adam
# create Ludwig configuration dictionary
# define model configuration
config = {'combiner': {'dropout': 0.2,
              'num_fc_layers': 3,
              'output_size': 128,
              'type': 'concat'},
 'input_features': [{'name': 'age', 'type': 'number'},
                    {'name': 'workclass', 'type': 'category'},
                    {'name': 'fnlwgt', 'type': 'number'},
                    {'name': 'education', 'type': 'category'},
                    {'name': 'education-num', 'type': 'number'},
                    {'name': 'marital-status', 'type': 'category'},
                    {'name': 'occupation', 'type': 'category'},
                    {'name': 'relationship', 'type': 'category'},
                    {'name': 'race', 'type': 'category'},
                    {'name': 'sex', 'type': 'category'},
                    {'name': 'capital-gain', 'type': 'number'},
                    {'name': 'capital-loss', 'type': 'number'},
                    {'name': 'hours-per-week', 'type': 'number'},
                    {'name': 'native-country', 'type': 'category'}],
 'output_features': [{'name': 'income',
                      'num_fc_layers': 4,
                      'output_size': 32,
                      'preprocessing': {'fallback_true_label': ' >50K'},
                      'loss': {'type': 'binary_weighted_cross_entropy'},
                      'type': 'binary'}],
 'preprocessing': {'number': {'missing_value_strategy': 'fill_with_mean',
                              'normalization': 'zscore'}},
 'trainer': {'epochs': 10, 'optimizer': {'type': 'adam'}}}

# instantiate Ludwig model object
model = LudwigModel(config=config, logging_level=logging.INFO)
Train the model.
ludwig train \
  --dataset adult_census_income.csv \
  --config config.yaml
# Trains the model. This cell might take a few minutes.
train_stats, preprocessed_data, output_directory = model.train(training_set=train_df,
                                                               test_set=test_df)
Evaluate
ludwig evaluate --model_path results/experiment_run/model \
                 --dataset evaluation_dataset.csv \
                 --output_directory test_results
# Generates predictions and performance statistics for the test set.
test_stats, predictions, output_directory = model.evaluate(
  eval_df,
  collect_predictions=True,
  collect_overall_stats=True,
  skip_save_eval_stats=False,
  skip_save_predictions=False,
  output_directory="test_results",
  return_type="dict"
)
Visualize Metrics
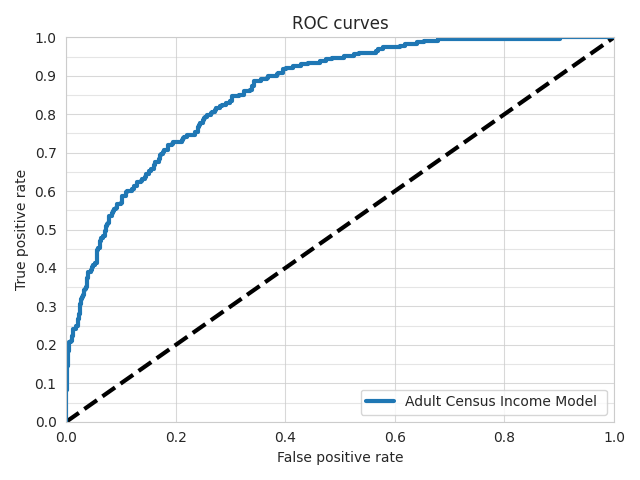
ROC Curve
ludwig visualize roc_curves command
!ludwig visualize --visualization roc_curves \
                  --ground_truth evaluation_dataset.csv \
                  --ground_truth_metadata results/experiment_run/model/training_set_metadata.json \
                  --probabilities test_results/predictions.parquet \
                  --output_feature_name income \
                  --output_directory visualizations \
                  --model_names "Adult Census Income Model" \
                  --file_format png
visualize.roc_curves() function
from ludwig.visualize import roc_curves

roc_curves(
    [predictions['income']['probabilities']],
    eval_df['income'],
    preprocessed_data[-1],
    'income',
    '1',
    model_names=["Adult Census Income"],
    output_directory='visualization',
    file_format='png'
)
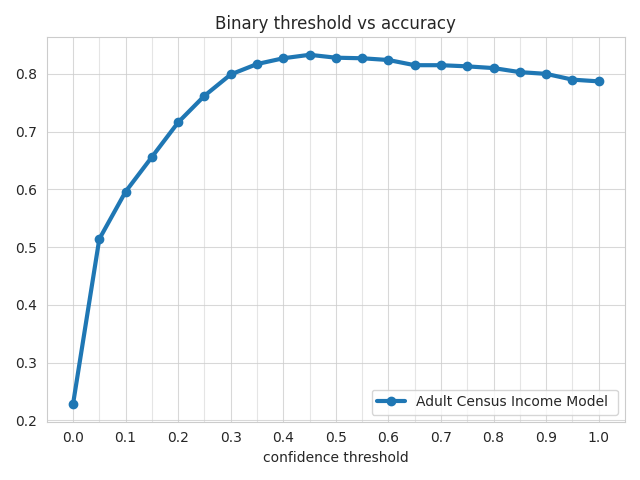
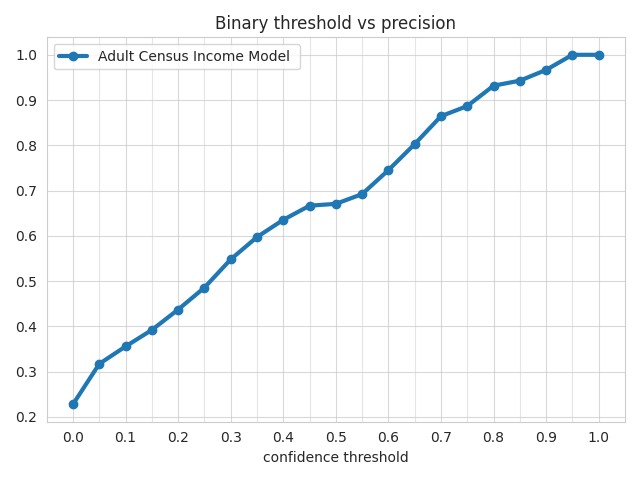
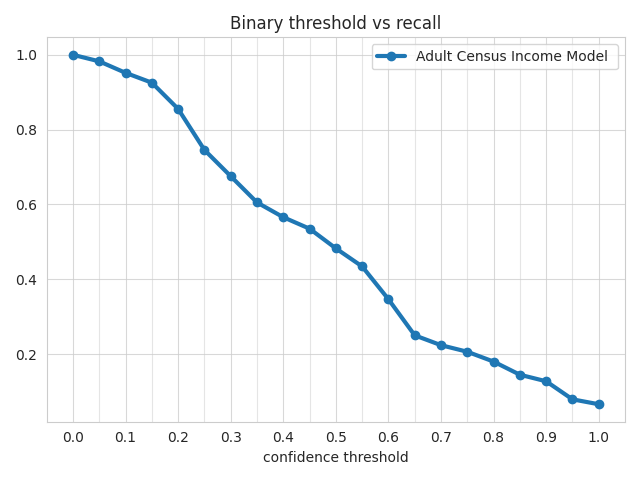
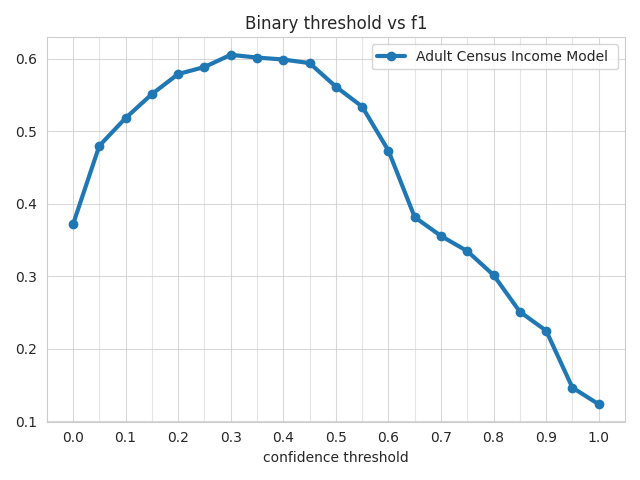
Binary Threshold Metrics
ludwig visualize binary_threshole_vs_metric command
ludwig visualize --visualization binary_threshold_vs_metric \
                  --ground_truth evaluation_dataset.csv \
                  --ground_truth_metadata results/experiment_run/model/training_set_metadata.json \
                  --probabilities test_results/predictions.parquet \
                  --output_feature_name income \
                  --positive_label 1 \
                  --output_directory visualizations \
                  --model_names "Adult Census Income Model" \
                  --metrics accuracy precision recall f1\
                  --file_format png
visualize.binary_threshold_vs_metric() function
from ludwig.visualize import binary_threshold_vs_metric

binary_threshold_vs_metric(
    [predictions["income"]["probabilities"]],
    eval_df["income"],
    preprocessed_data[-1],
    "income",
    ["accuracy", "precision", "recall", "f1"],
    1,
    model_names=["Adult Census Income"],
    output_directory="visualization",
    file_format="png",
)
Accuracy Metric
Precision Metric
Recall Metric
F1 Metric
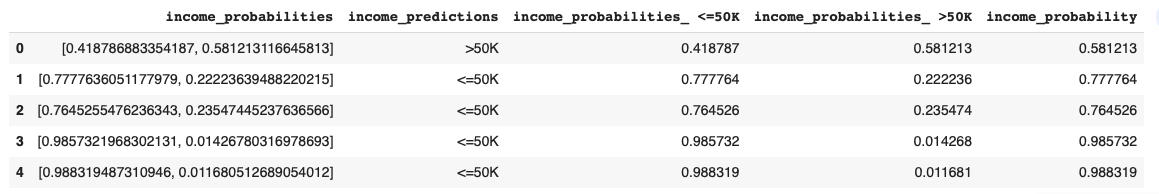
Predictions
ludwig predict --model_path results/experiment_run/model \
                --dataset evaluation_dataset.csv \
                --output_directory predictions
predictions, prediction_results = model.predict(dataset=eval_df, skip_save_predictions=False, output_directory="predictions_results")
Sample predictions