Hyperparameter Optimization
This is a complete example of Ludwig's hyperparameter optimization capability.
These interactive notebooks follow the steps of this example:
- Ludwig CLI:

- Ludwig Python API:
Download the Adult Census Income dataset
Adult Census Income is an extract of 1994 Census data for predicting whether a person's income exceeds $50K per year. The data set consists of over 49K records with 14 attributes with missing data.
ludwig datasets download adult_census_income
This command will create a dataset adult_census_income.csv in the current directory.
The columns in the dataset are
| column | description |
|---|---|
| age | numeric variable, age of person |
| workclass | categorical variable, Type of empolyment |
| fnlwgt | numeric variable, no defintion |
| education | categorical variable, education level |
| education-num | nmeric variable, no definition |
| marital-status | categorical variable, marital status |
| occupation | categorical variable, occupation |
| relationship | categorical variable, Relationship to household |
| race | categorical variable, race |
| sex | categorical variable, gender |
| capital-gain | numeric variable, no definition |
| capital-loss | numeric variable, no definition |
| hours-per-week | numeric variable, hours worked per week |
| native-country | categorical variable, Country of origin |
| income | binary variable, " <=50K" or " >50K" |
| split | numeric variable, indicating data split training(0), test(2) |
Setup for hyperparameter optimization run
Hyperparameter optimization is defined with the hyperopt section of the Ludwig configuration specification.
preprocessing:
    ...
input_features:
    ...
combiner:
    ...
output_features:
    ...
trainer:
    ...

# hyperopt specification
hyperopt:
    # specify parameters for the Ray Tune to executor to run the hyperparameter optimization
    executor:
        ...
    # specify Ray Tune search algorithm to use
    search_alg:
        ...
    # hyperparameter search space for the optimization
    parameters:
        ...
    # minimize or maximize the metric score
    goal: ...
    # metric score to optimize
    metric: ...
    # name of the output feature
    output_feature: ...
# define model configuration
config = {
    'combiner': ... ,
    'input_features': ... ,
    'output_features': ... ,
    'preprocessing': ...,
    'trainer':... ,

    # hyperopt specification
    'hyperopt':  {
        # specify parameters for the Ray Tune to executor to run the hyperparameter optimization
        'executor': {'type': 'ray', ... },
        # specify Ray Tune search algorithm to use
        'search_alg': {... },
        # hyperparameter search space for the optimization
        'parameters': {...},
        # minimize or maximize the metric score
        'goal': ...,
        # metric score to optimize
        'metric': ...,
        # name of the output feature
        'output_feature': ...,
    }
}
Hyperparameter Search Space Specification
For this example, we want to determine the effect of Ludwig's Trainer's learning_rate and num_fc_layers of the income output feature on model's roc_auc metric. To do this we will use two different hyperparameter optimization approaches: Random Search and Grid Search.
Random Search
hyperopt:
    executor:
        num_samples: 16
    goal: maximize
    metric: roc_auc
    output_feature: income
    parameters:
        income.num_fc_layers:
            space: randint
            lower: 2
            upper: 9
        trainer.learning_rate:
            space: loguniform
            lower: 0.001
            upper: 0.1
    search_alg:
        type: variant_generator
        random_state: 1919
 'hyperopt': {
    'executor': {'num_samples': 16, },
    'goal': 'maximize',
    'metric': 'roc_auc',
    'output_feature': 'income',
    'parameters': {
        'income.num_fc_layers': {
            'space': 'randint',
            'lower': 2,
            'upper': 9
        },
        'trainer.learning_rate': {
            'space': 'loguniform',
            'lower': 0.001,
            'upper': 0.1}
        },
    'search_alg': {'type': 'variant_generator', 'random_state': 1919, }
},
Grid Search
hyperopt:
    executor:
        num_samples: 1
    goal: maximize
    metric: roc_auc
    output_feature: income
    parameters:
        income.num_fc_layers:
            space: grid_search
            values: [2, 4, 6, 8]
        trainer.learning_rate:
            space: grid_search
            values: [0.001, 0.003, 0.007, 0.01]
    search_alg:
        type: variant_generator
        random_state: 1919
'hyperopt': {
    'executor': {'num_samples': 1,},
    'goal': 'maximize',
    'metric': 'roc_auc',
    'output_feature': 'income',
    'parameters': {
        'income.num_fc_layers': {'space': 'grid_search', 'values': [2, 4, 6, 8]},
        'trainer.learning_rate': {'space': 'grid_search', 'values': [0.001, 0.003, 0.007, 0.01]}},
    'search_alg': {'type': 'variant_generator', 'random_state': 1919, }
},
Run Hyperparameter Optimization
Here are example commands/function call to run Ludwig's hyperparameter optimization capability.
ludwig hyperopt --dataset adult_census_income.csv \
  --config config.yaml \
  --output_directory results \
  --hyperopt_log_verbosity 1
hyperopt_results = hyperopt(
    config,
    dataset=adult_census_df,
    output_directory="results",
    hyperopt_log_verbosity=1
)
Visualize Hyperparameter Optimization Results
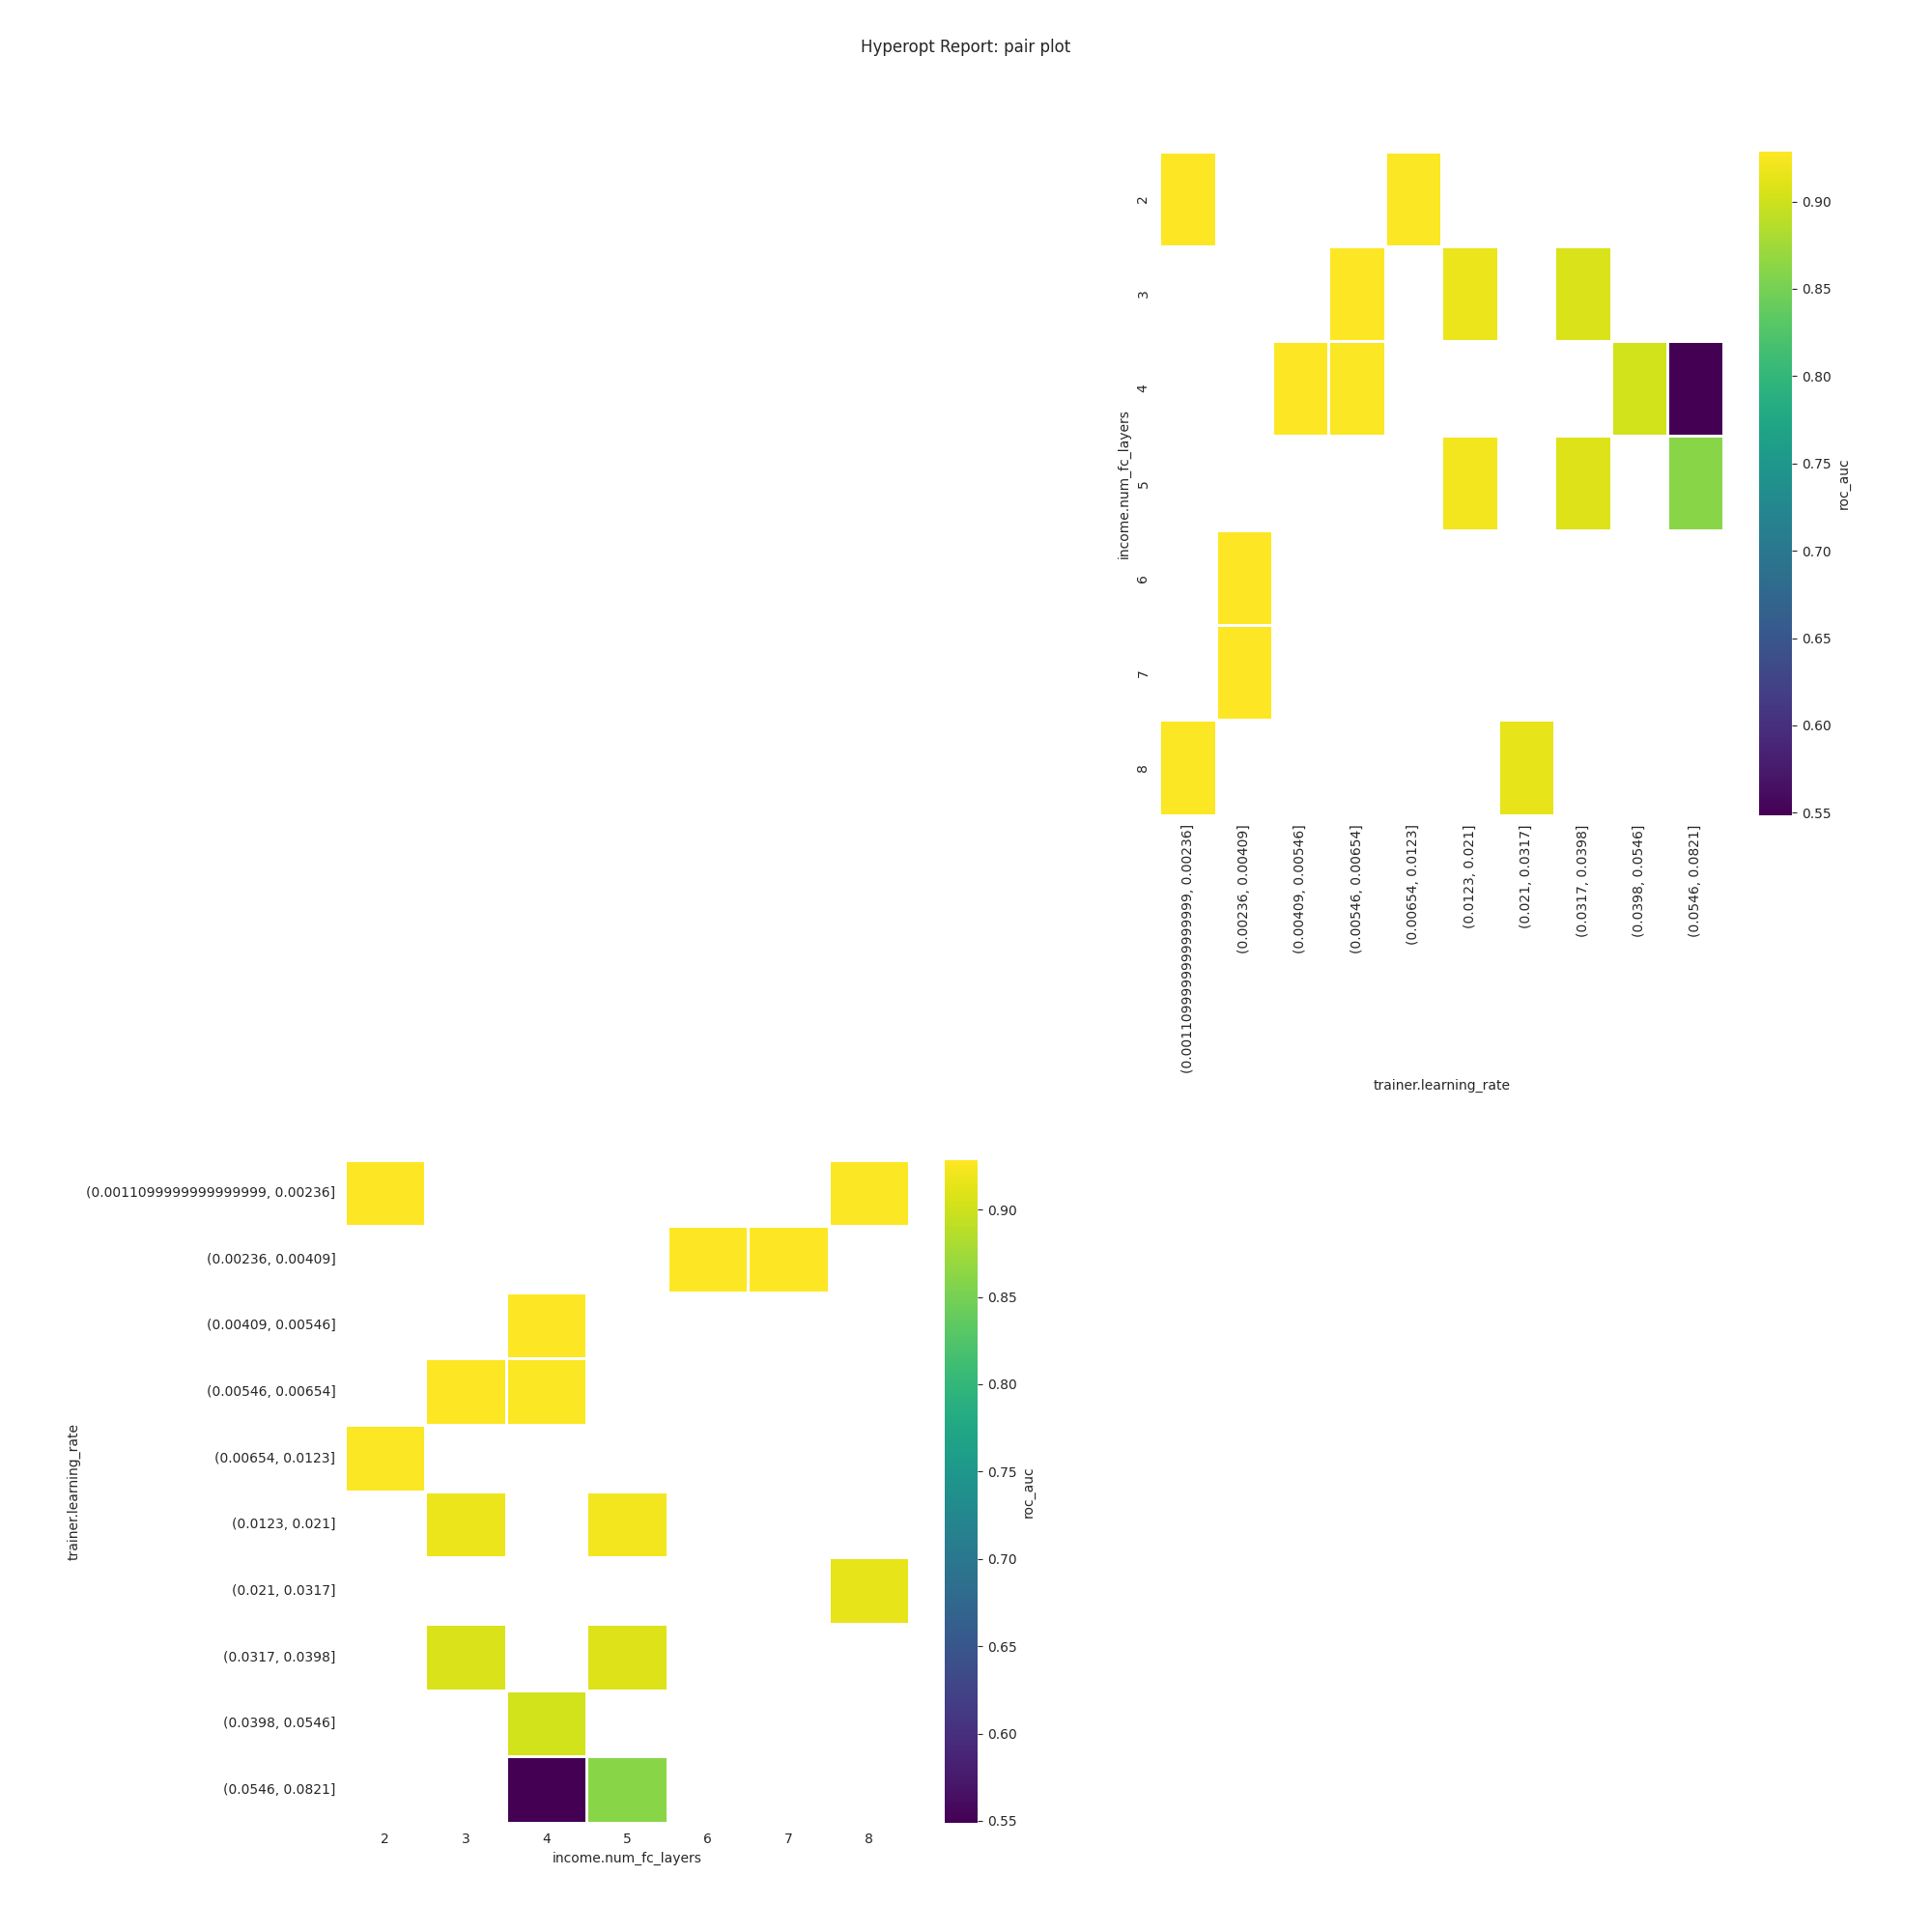
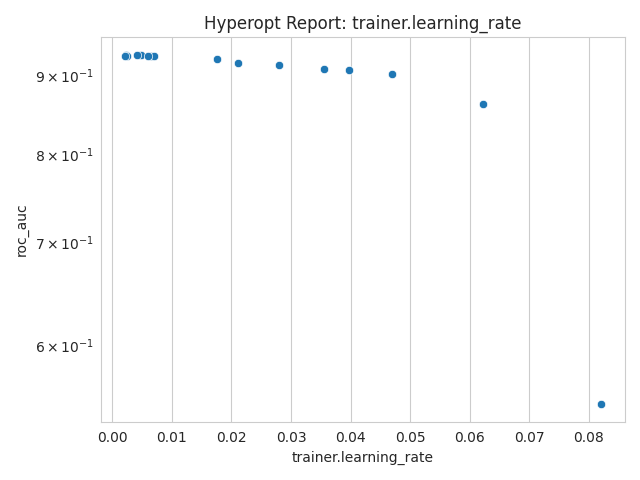
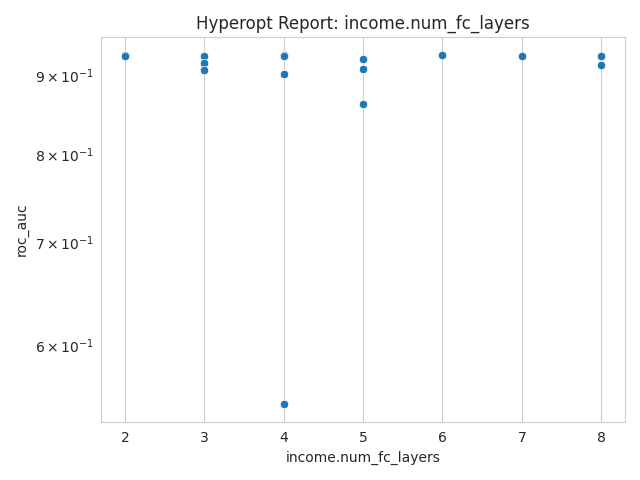
ludwig visualize hyperopt_report command
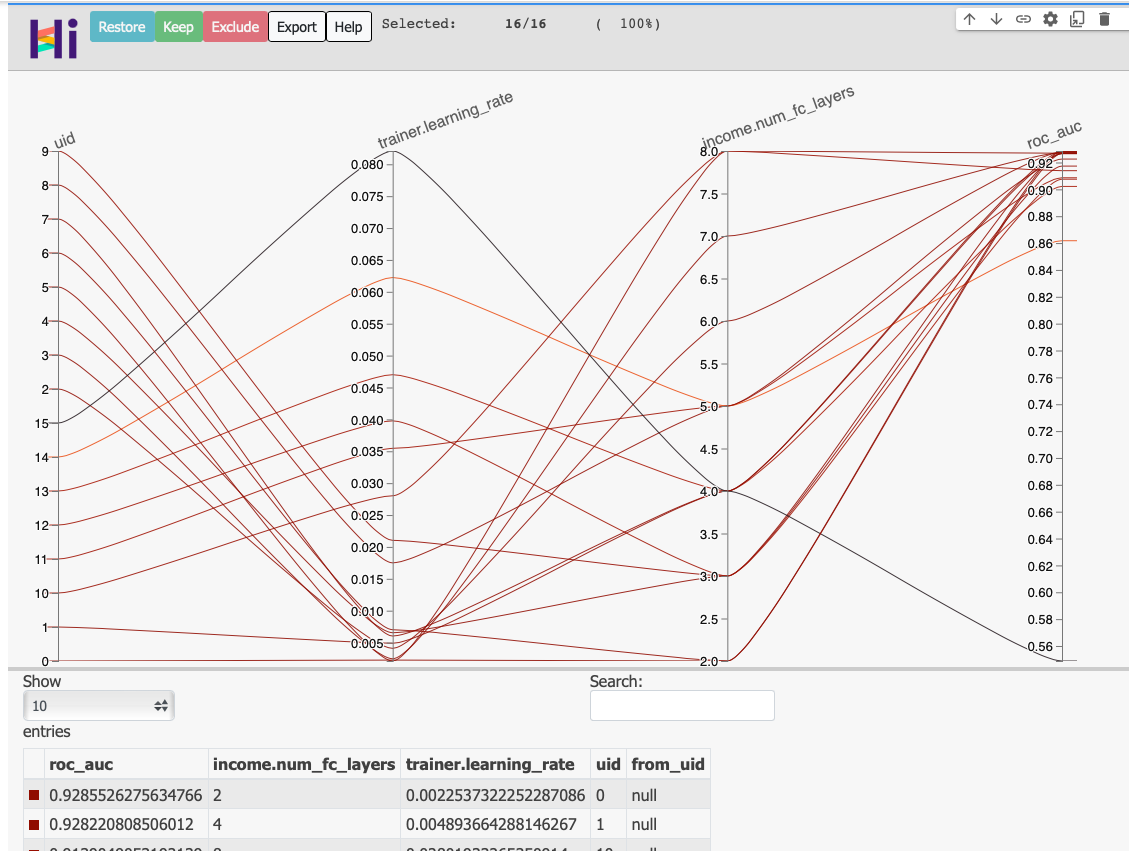
ludwig visualize hyperopt_hiplot command
# generate visualizations on hyperparameter effects on the metric
ludwig visualize --visualization hyperopt_report \
              --hyperopt_stats_path results/hyperopt_statistics.json \
              --output_directory visualizations \
              --file_format png

# generate hyperopt hiplot parallel coordinate visualization
ludwig visualize --visualization hyperopt_hiplot \
                  --hyperopt_stats_path results/hyperopt_statistics.json \
                  --output_directory visualizations
visualize.hyperopt_report() function
visualize.hyperopt_hiplot() function
hyperopt_report("./rs_output/hyperopt_statistics.json")

hyperopt_hiplot("./rs_output/hyperopt_statistics.json", output_directory="visualizations")
hyperopt_report
hyperopt_hiplot