Multimodal Classification
This example shows how to build a multimodal classifier with Ludwig.
If you'd like to run this example interactively in Colab, open one of these notebooks and try it out:
- Ludwig CLI:

- Ludwig Python API:
Note: you will need your Kaggle API token
We'll be using the twitter human-bots dataset, originally uploaded to Kaggle by David Martín Gutiérrez. The dataset is composed of 37438 rows each corresponding to a Twitter user account. Each row contains 20 feature columns collected via the Twitter API. These features contain multiple data modalities, including the account description and the profile image.
The target column account_type has two unique values: bot or human. 25013 user accounts were annotated as human accounts, the remaining 12425 are bots.
This dataset contains 20 columns, but we'll only use these 16 (15 input + 1 target):
| column | type | description |
|---|---|---|
| default_profile | binary | Does the account have a default profile |
| default_profile_image | binary | Does the account have a default profile image |
| description | text | User account description |
| favorites_count | number | Total number of favorited tweets |
| followers_count | number | Total number of followers |
| friends_count | number | Total number of friends |
| geo_enabled | binary | Does the account has the geographic location enabled |
| lang | category | Language of the account |
| location | category | Location of the account |
| profile_background_image_path | image | Profile background image path |
| profile_image_path | image | Profile image path |
| statuses_count | number | Total number of tweets |
| verified | binary | Has the account been verified |
| average_tweets_per_day | number | Average tweets posted per day |
| account_age_days | number | Account age measured in days |
| account_type | binary | "human" or "bot", true if the account is a bot |
Kaggle API Token (kaggle.json)
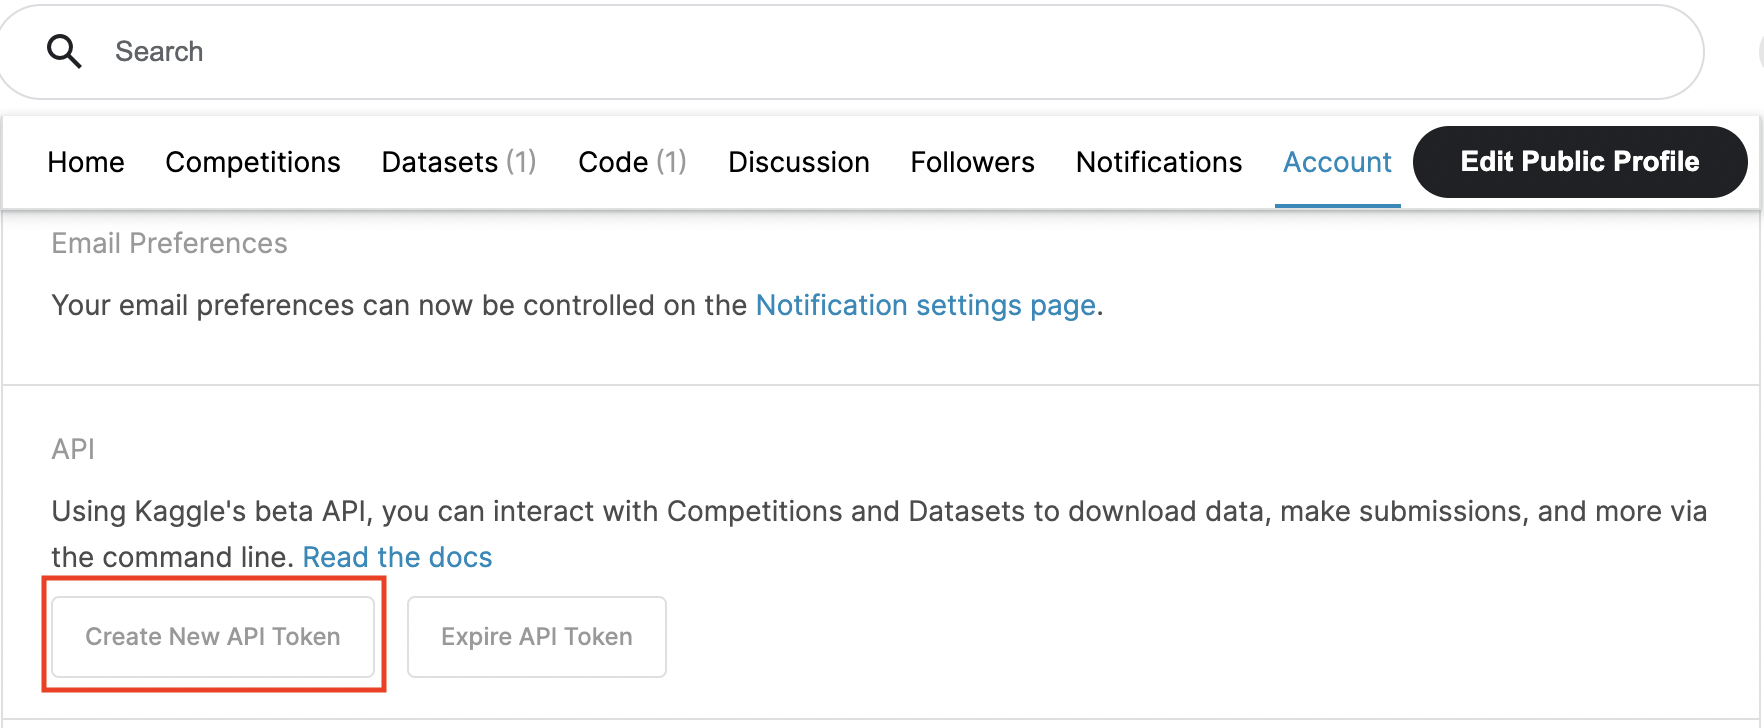
To download datasets using the Kaggle CLI, you'll need a Kaggle API Token.
If you already have one, it should be installed at ~/.kaggle/kaggle.json. Run this command in a shell, and copy the
output:
cat ~/.kaggle/kaggle.json
If you don't have a kaggle.json file:
- Sign in to Kaggle. If you don't already have an account, create one.
- Go to "Account", and click the "Create New API Token" button. This should start the download.
- Following the Kaggle instructions, copy your
kaggle.jsonfrom its download location to a directory called.kagglein your home directory. - If you want to run this example in either of the example Colab notebooks, open kaggle.json and copy its contents to the clipboard. The kaggle.json file should look similar to:
{"username":"your_user_name","key":"_______________________________"}
Download Dataset
Downloads the dataset and creates twitter_human_bots_dataset.csv in the current directory.
# Downloads the dataset to the current working directory
kaggle datasets download danieltreiman/twitter-human-bots-dataset

# Unzips the downloaded dataset, creates twitter_human_bots_dataset.csv
unzip -q -o twitter-human-bots-dataset.zip
Train
Define ludwig config
The Ludwig config declares the machine learning task: which columns to use, their datatypes, and which columns to predict.
Note
There are only 20 unique background images, so we've declared profile_background_image_path as a category instead
of an image. Image encoders need a large number of unique images to perform well and will quickly overfit given such
a small sample.
With config.yaml:
input_features:
  - name: default_profile
    type: binary
  - name: default_profile_image
    type: binary
  - name: description
    type: text
  - name: favourites_count
    type: number
  - name: followers_count
    type: number
  - name: friends_count
    type: number
  - name: geo_enabled
    type: binary
  - name: lang
    type: category
  - name: location
    type: category
  - name: profile_background_image_path
    type: category
  - name: profile_image_path
    type: image
  - name: statuses_count
    type: number
  - name: verified
    type: binary
  - name: average_tweets_per_day
    type: number
  - name: account_age_days
    type: number
output_features:
  - name: account_type
    type: binary
With config defined in a python dict:
config = {
  "input_features": [
    {
      "name": "default_profile",
      "type": "binary",
    },
    {
      "name": "default_profile_image",
      "type": "binary",
    },
    {
      "name": "description",
      "type": "text",
    },
    {
      "name": "favourites_count",
      "type": "number",
    },
    {
      "name": "followers_count",
      "type": "number",
    },
    {
      "name": "friends_count",
      "type": "number",
    },
    {
      "name": "geo_enabled",
      "type": "binary",
    },
    {
      "name": "lang",
      "type": "category",
    },
    {
      "name": "location",
      "type": "category",
    },
    {
      "name": "profile_background_image_path",
      "type": "category",
    },
    {
      "name": "profile_image_path",
      "type": "image",
    },
    {
      "name": "statuses_count",
      "type": "number",
    },
    {
      "name": "verified",
      "type": "binary",
    },
    {
      "name": "average_tweets_per_day",
      "type": "number",
    },
    {
      "name": "account_age_days",
      "type": "number",
    },
  ],
  "output_features": [
    {
      "name": "account_type",
      "type": "binary",
    }
  ]
}
Create and train a model
ludwig train --dataset twitter_human_bots_dataset.csv -c config.yaml
import pandas as pd

# Reads the dataset from CSV file.
dataset_df = pd.read_csv("twitter_human_bots_dataset.csv")

# Constructs Ludwig model from config dictionary
model = LudwigModel(config, logging_level=logging.INFO)

# Trains the model. This cell might take a few minutes.
train_stats, preprocessed_data, output_directory = model.train(dataset=dataset_df)
Evaluate
Generates predictions and performance statistics for the test set.
ludwig evaluate \
    --model_path results/experiment_run/model \
    --dataset twitter_human_bots_dataset.csv \
    --split test \
    --output_directory test_results
# Generates predictions and performance statistics for the test set.
test_stats, predictions, output_directory = model.evaluate(
  dataset_df[dataset_df.split == 1],
  collect_predictions=True,
  collect_overall_stats=True
)
Visualize Metrics
Visualizes confusion matrix, which gives an overview of classifier performance for each class.
ludwig visualize \
    --visualization confusion_matrix \
    --ground_truth_metadata results/experiment_run/model/training_set_metadata.json \
    --test_statistics test_results/test_statistics.json \
    --output_directory visualizations \
    --file_format png
from ludwig.visualize import confusion_matrix

confusion_matrix(
  [test_stats],
  model.training_set_metadata,
  'account_type',
  top_n_classes=[2],
  model_names=[''],
  normalize=True,
)
| Confusion Matrix | Class Entropy |
|---|---|
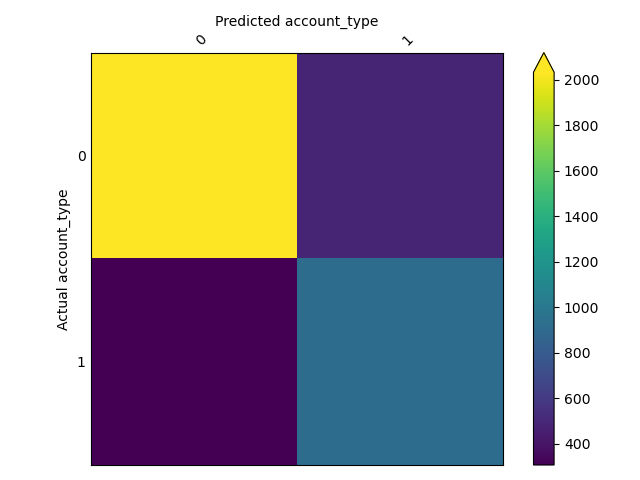 |
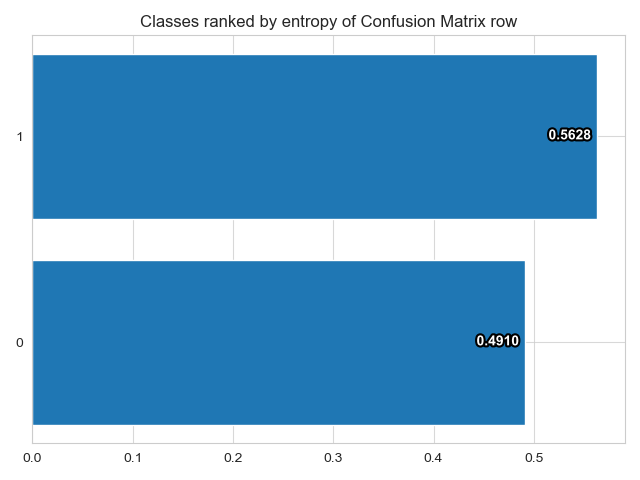 |
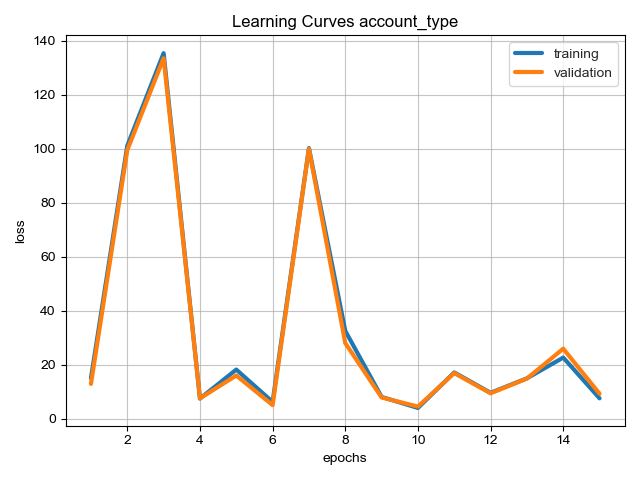
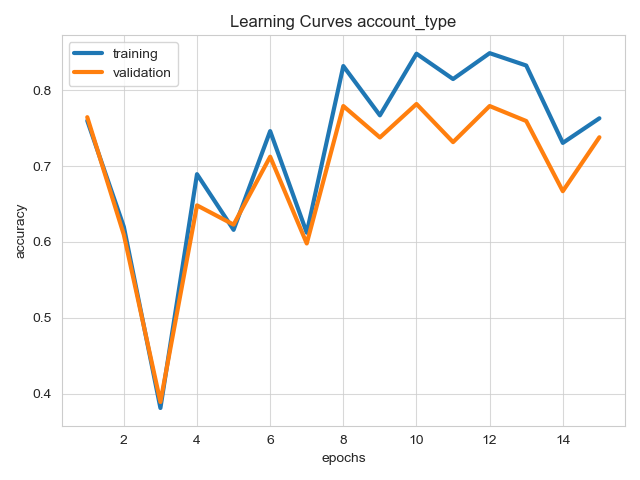
Visualizes learning curves, which show how performance metrics changed over time during training.
ludwig visualize \
    --visualization learning_curves \
    --ground_truth_metadata results/experiment_run/model/training_set_metadata.json \
    --training_statistics results/experiment_run/training_statistics.json \
    --file_format png \
    --output_directory visualizations
# Visualizes learning curves, which show how performance metrics changed over time during training.
from ludwig.visualize import learning_curves

learning_curves(train_stats, output_feature_name='account_type')
| Losses | Metrics |
|---|---|
 |
 |